Hedge Cost Update for FIA and RILA products - 11-April 2024
FIA – 1 Year
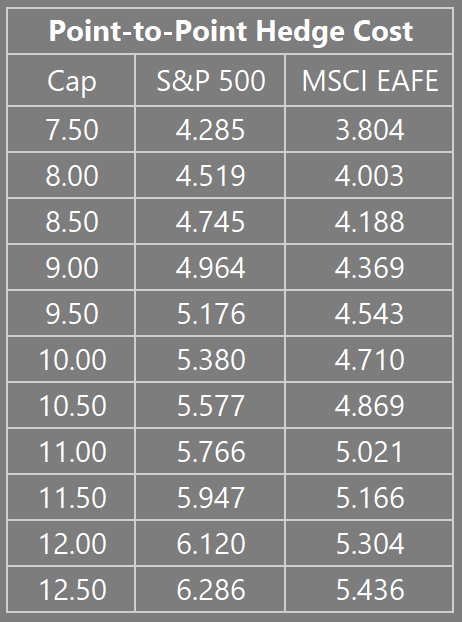
Here, we show the latest estimates of hedge costs of popular FIA designs. The hedge costs were obtained using market data of Thursday, April 11, 2024. Given a particular index, tenor and strike, FIA hedge costs tend to be quite stable on a day-to-day basis, with volatility (call) skew being the top driver of variation in hedge (option) costs. All the hedge costs are estimated for 1 year tenor.
Figure 1 : Point-to-point caps from 7.5% to 12.5% are priced. For example, the expected hedge costs of 10% cap (1 year) are 5.38% for SPX 500 and 4.71% for MSCI EAFE Index, as of April 11, 2024.
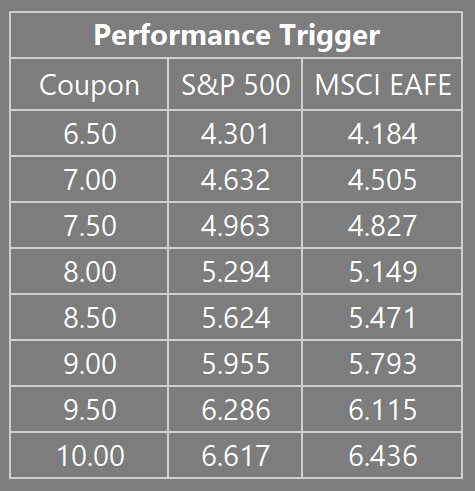
Figure 2: Performance Trigger is another highly popular FIA design. The trigger threshold is set to ATM level. Coupon is varied from 6.5% to 10%.
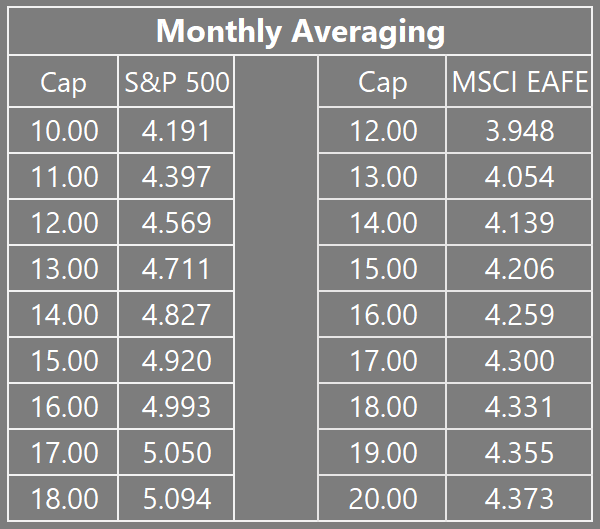
Figure 3: Monthly Averaging hedge costs tends to be lower than Point-to-Point because the 'average' of monthly observations (strikes) is expected to be less volatile than a single point observation (strike) used for Point-to-Point.
RILA - 1 Year
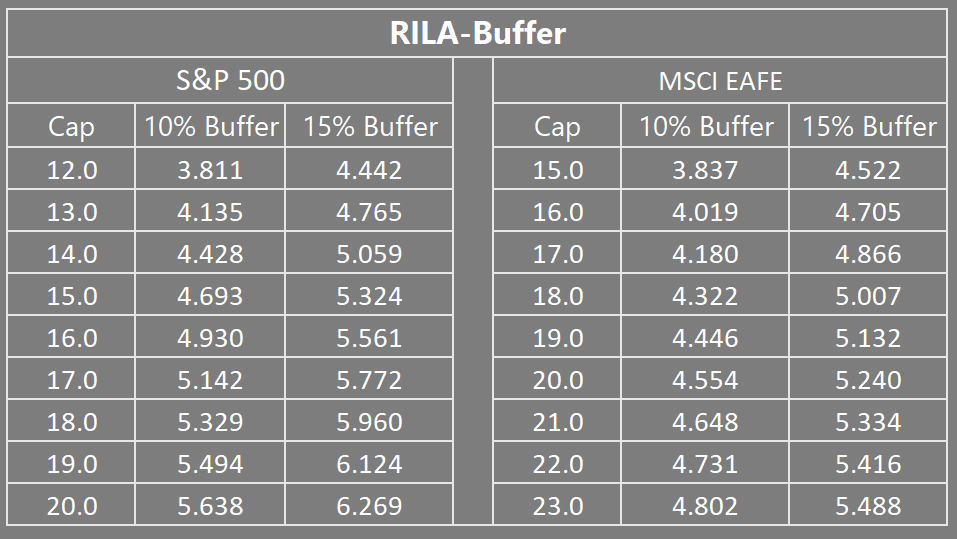
Hedge cost estimates for RILA tend to be slightly more noisy day-over-day (5-10 bps), since both call and put volatilty skew impact the overall hedge cost. Puts for indices other than S&P 500 Index can be illiquid at times, leading to higher dealer markups. For these hedge costs estimates, the tenor is fixed to 1 year.
Figure 4: RILA hedge costs tend to show higher variability (5-10 bps average) day-over-day since both call skew and put skew independently drive the overall hedge cost. Higher buffer is less riskly for the retiree, and consequently more expensive to hedge for the insurer.
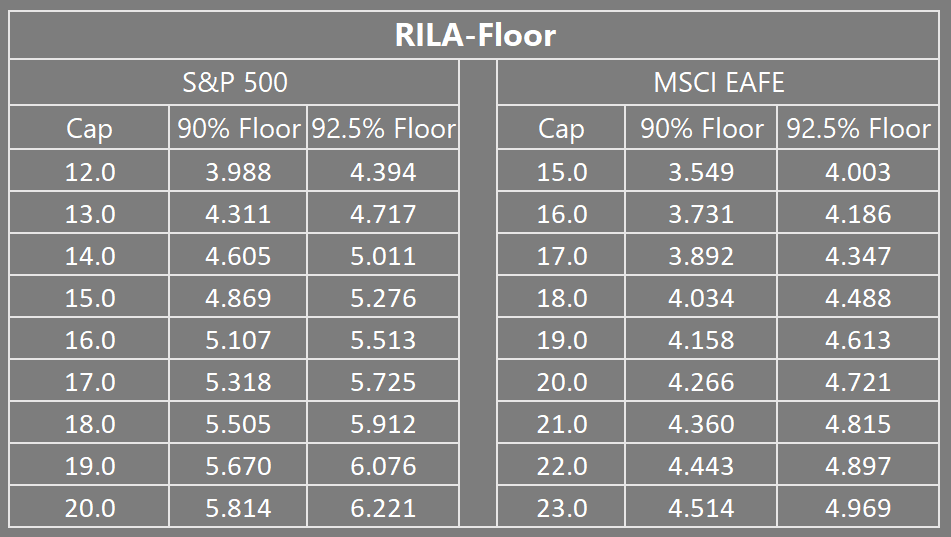
Figure 5: To make a valid comparison with RILA Buffer levels of 10% and 15%, the Floor levels were set to 90% and 92.5%. Higher floor is less risky for the retiree and consequently more expensive to hedge for the insurer.