Higher rates are unarguably the best thing to happen to the annuity market. Many of us don’t realize that the much larger size of the annuity market in the US, compared to the UK or Europe, is very much a consequence of the high nominal interest rates American savers enjoyed from 1969 to 1990. Nothing attracts savers more than high nominal rates. Remember, FED’s Operation Twist program in 2011–2012 was specifically aimed at curbing the attractiveness of higher long-term nominal interest rates.
Even though rates have increased significantly in the last quarter, and although the short end of the yield curve continues to imply rate cuts in 2023 (more on that later), we think there is room for higher rates in the coming quarters. To help annuity providers prepare for higher rates, we have prepared a brief cheat sheet.
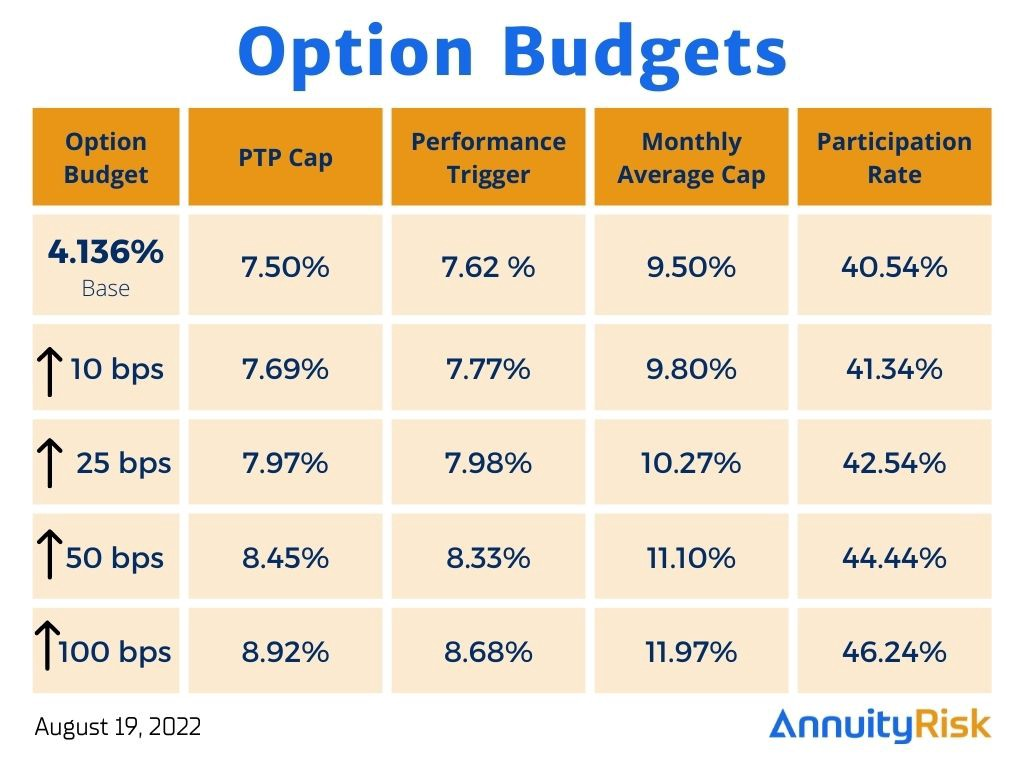
Essentially, we have attempted to determine the impact of higher option budgets on various popular product designs (payoffs) for fixed indexed annuities using S&P 500 Index as the model case.ir product assortment and push out the demand curve.
Primary Assumptions
We have anchored our option budgets to the cost of the hedge for S&P 500 Point-to-Point 1 year Cap Rate of 7.50% with an approximately 5 year long surrender charge. We determined that the option cost for such a payoff is 4.14%. While keeping the option budget fixed at 4.14%, we determine the base case caps and participation rates for other payoffs. Then we model the impact of increasing option budgets by 10 bps, 25 bps, 50 bps and 75 bps.
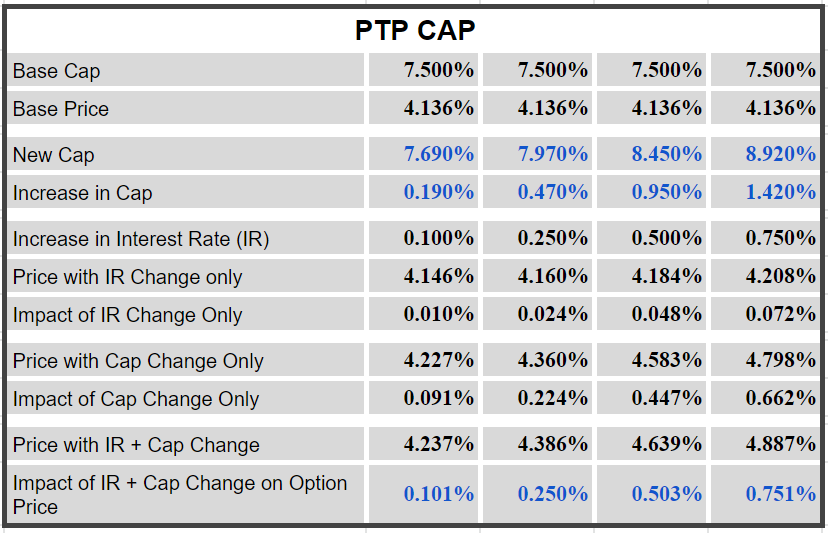
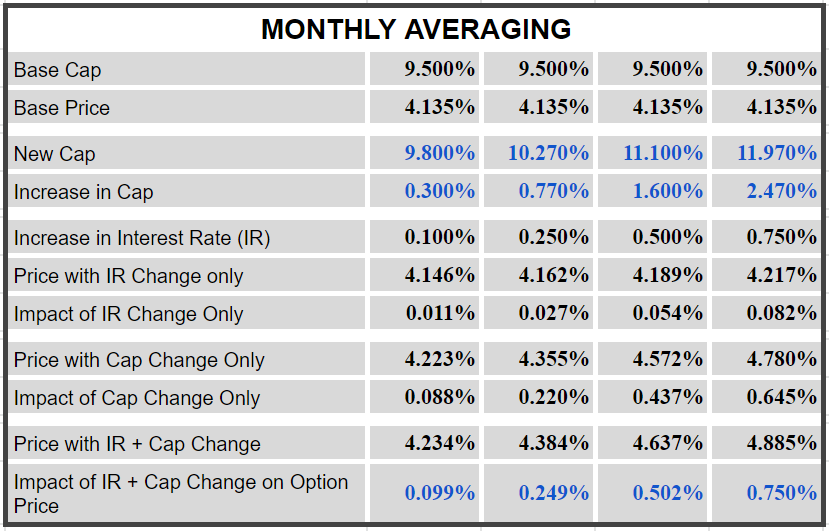
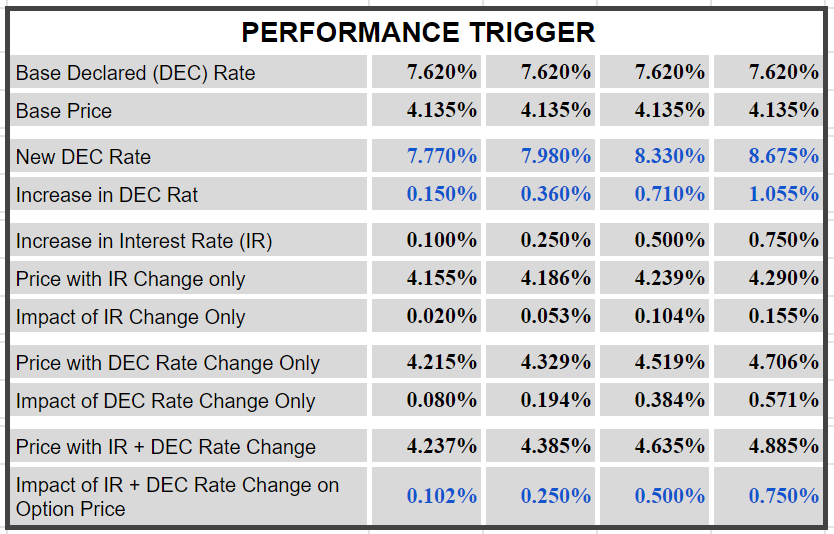
Next, we present a more detailed analysis of higher option budgets on cap and participation rates. While higher interest rates (higher budget) push cap and par rates higher, they also make the overall option more expensive (due to higher cost of capital), all things equal. Hence we have modelled the impact of higher interest rates and higher caps separately, and then together.
Payoffs
All interest rates are reset annually on the policy anniversary date. A negative index return results in a zero-interest credit.
Based on market data of the S&P 500 Index as of the close of Friday, August 19, 2022.
Below is a quick summary of different payoffs.
PTP CAP: Interest is credited annually based on the annual point-to-point return of an index such as the S&P 500 Index, up to a maximum rate called the cap rate.
Participation Rate: Interest is credited annually based on the annual point-to-point return of an index such as the S&P 500 Index, times a participation rate.
Performance Trigger: A declared interest rate is credited if the index return is positive or flat.
Monthly Averaging: Index return is calculated using a monthly arithmetic average of an index since inception. Index return is capped at a cap rate and floored at zero.